One of the biggest challenges in teaching math is allowing students to understand things that are abstract. For instance consider this possible definition for area: “A measure of the two-dimensional space within or occupied by a plane figure or region.” While this seem perfectly serviceable to a math teacher, students may struggle to conceptualize exactly what it means. What exactly does two-dimensional space mean? What does it mean to be “within” a figure or to “occupy” space?
These seem simple, but there are subtleties to understanding what area really is, which I’ve even seen calculus students mess up with. If you ask students what area is, they often respond with something like “area is the inside, and perimeter is the outside,” but then can’t elaborate on that. The common confusion between concepts of length and area is demonstrated by students frequently stating the area of a shape in length units.
This is why I like using the cutting and pasting of paper to represent area. I find students can conceptualize the amount of paper used to make a shape much easier than the abstract idea of “area”, even though they are fundamentally the same thing. Students can understand that one shape has more area than another using the fact that it took more paper to make. Also, if you can demonstrate that two shapes can be constructed from the exact same amount of paper, students can understand that they have equivalent areas.
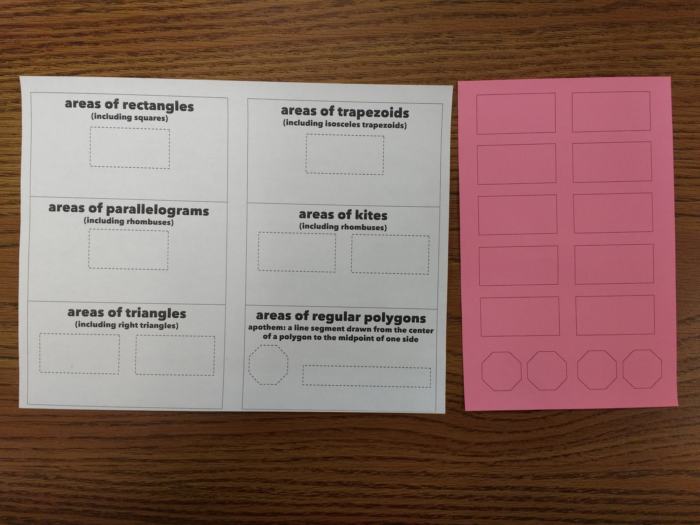
This activity uses the area of a rectangle to find the areas of other polygons. Students are given a page with templates for the shapes they’re going to create, and a colored half sheet of rectangles and octagons. (The colored half sheet is actually double the number of shapes they need, but it makes things easier to have spares if they make mistakes.)
Everyone also needs a glue stick, a pair of scissors, a ruler and a pencil.
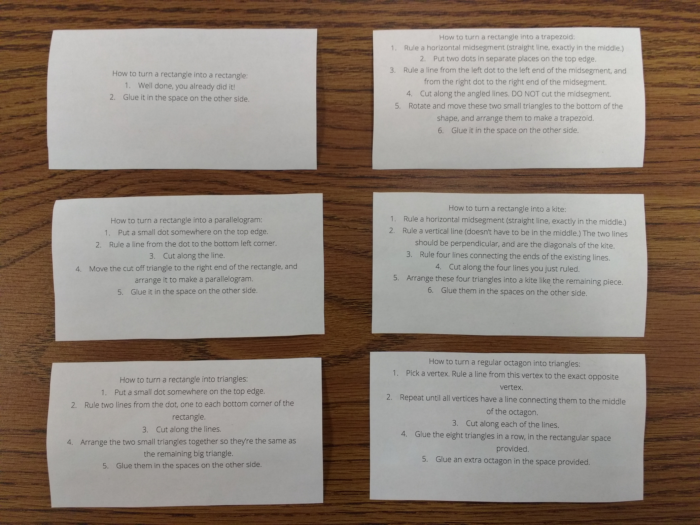
The white sheet can be cut into the six separate sections. On the back of each section, there are instructions on how to construct the given shape from a rectangle.
Students should follow the instructions to construct each shape from one of the small colored rectangles. Reactions will range from “this is easy”, to “I think I’ve got it, can I check what you did”, to “this is impossible!” Make sure you’re cycling around the room a lot, because students can and will fall behind quickly if they’re not paying attention. Frustratingly, I found most of the students who thought the instructions didn’t make sense hadn’t actually taken the time to read them step-by-step.
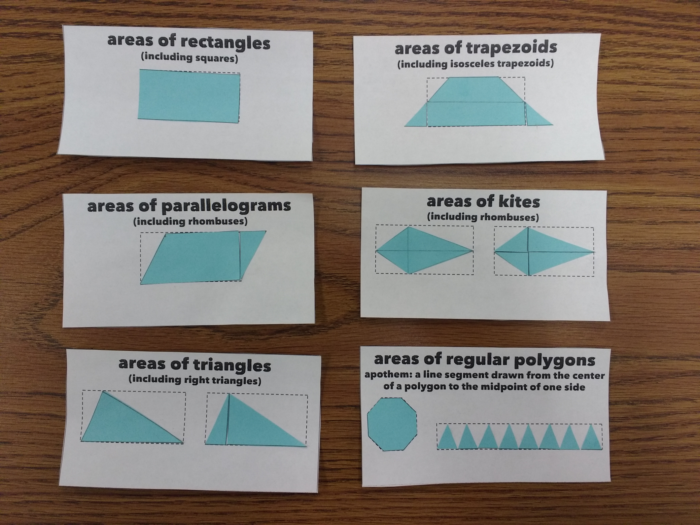
I suggest doing them in the order of rectangle, parallelogram, triangle, trapezoid, kite and polygon. Once they’re done, they’ll look something like this:
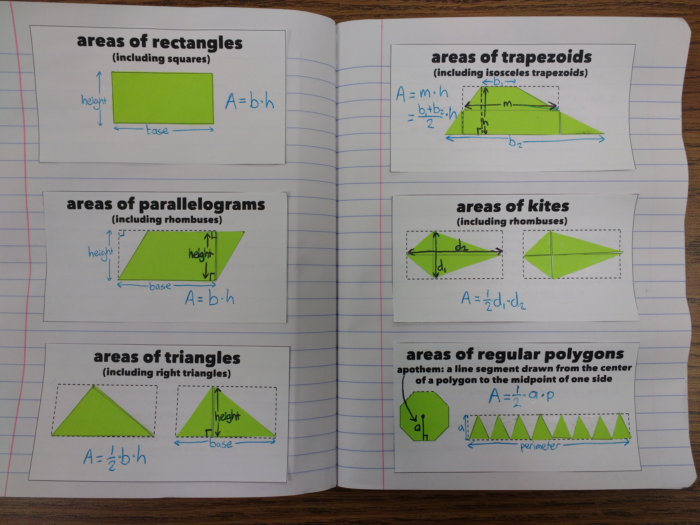
The idea is that each shape has an area equivalent to a rectangle in some way, because they used the same amount of paper. The triangle and the kite are related by a half, because one rectangle was able to make two of these shapes. The regular polygon is a little different, as it starts with the polygon and is deconstructed into half a rectangle; we know it’s half, as we already showed that triangles make the area a half. Add some labels to the shapes, and you get something like this:
In the trapezoid, “m” is referring to the midsegment (or median) of the trapezoid. We’ve already covered the the theorem that says the midsegment length is the mean of the base length, which is why we’re able to substitute (b1 + b2)/2 for m without any further working.
If you’d like to do this, files can be downloaded here. Included are alternate versions for non-Americans who think “trapezoid” is a weird word. Font is Matiz.


Love it, totally using it. Thanks Shaun!