Quadratic Vertex Form Card Sort

Over the weekend, I needed a break from working on grad school assignments. At the same time, Sarah needed a card sort on the vertex form of quadratic functions. Being the nice husband I am, I thought I’d help. Being the nerd that I am, I did it in LaTeX.

This took a bit longer that I’d expected to create. I’ve a little experience creating graphs, so they weren’t too bad, but tables in LaTeX can be a little fiddly to get right. I also wouldn’t claim that took much thought went into choosing which functions to use. But, I’m pretty happy with the result.

You can download the files here. Included is the shuffled set of cards (pictured above), the cards sorted into the correct order, and a zip file of the original .tex files in case you want to modify them at all.

Edit (Oct 23): There were a couple of mistakes in the original version, it has been fixed now.


Function, Expression, Equation Poster

The other day, Sarah showed me this tweet, and told me she wanted to make a poster based on it:

She wasn’t sure how she would do it. I tried suggesting an idea I had, but we decided it might be easier if I just made it and let Sarah see what she thought. Turns out that she loved it:

She did get it laminated today, and it looks like this:

What I love about this is the way it demonstrates the differences between functions, expressions and equations, but also shows how there’s a connection between them too. This poster goes well with the set Sarah created about solutions, roots, zeros and x-intercepts; that’s how she’s got them in her room, after all!

Now, the poster doesn’t capture all the particulars of these algebraic tools; it’s just a simple poster showing one example. There were some comments on twitter about the fact this poster doesn’t completely define what a function is, particularly absent a discussion of sets. Also, there was concern that the equation example implies all equations are homogeneous. Both criticisms have an element of truth, but also miss the point of a poster that, by its nature, only has one example. I think posters serve the best as either reminders of topics already discussed or starting points to launch a deeper discussion or investigation. Please, never put a poster on a wall and assume that means you’ve taught a topic. For an example of how I’ve discussed functions before, see these notes that I used in Algebra 2 last year.

Downloads are here.

This one may be a little tricky to put together, so if you want some guidance, keep reading:

  1. Choose your three colors. The effect works best (and helps communicate the idea) if the middle color appears to be a blend of the other two. If you don’t want to think too hard, just use blue-green-yellow like me, but I’d love to see other color combinations too.
  2. Print the first page (function) on the first color (blue, in my case), and the second page (equation) on the last color (yellow).
  3. Print either page on the middle color (green). For this page, you only need the expression rectangle, which appears on both pages. Cut off the rest of the paper.
  4. Stack your three pages with the expression rectangle of each page overlapping, with the middle color on top. Make sure you line up the rectangles as perfectly as you can.
 

Which “range” are we talking about?

I’m becoming a student again this fall. As I’m preparing for that, I’ve been reading through some of the textbooks for the classes I’m taking, which has got me thinking about how we use the word “range”.

I’m talking about the range in the context of functions. The fact that I’m even having to clarify that I’m not talking about statistics, or an interval of integers, or the multitude of uses the word has outside of math, highlights just how ambiguous the word already is, without mentioning the ambiguity just within the context of functions!

To highlight the problem, I posted this poll on twitter last week:

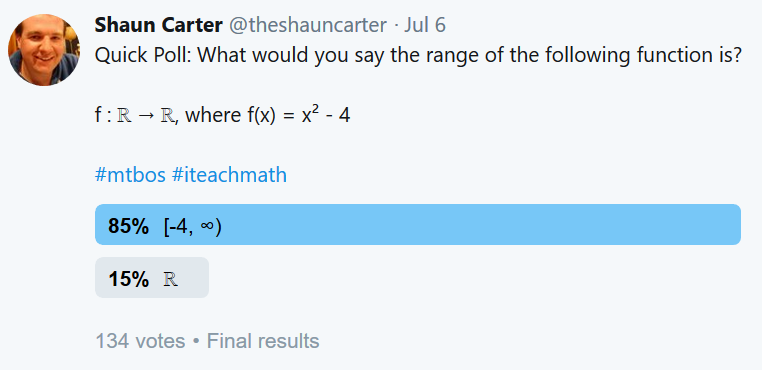
The correct answer to this question is… well, there isn’t one. It is a (deliberately) bad question because the meaning of “range” is unclear.

The question I was really asking was “Does the word ‘range’ refer to the image, or to the codomain, of a function?” And while most said that it refers to the image (which is what I would’ve said, prior to thinking about this), 15% chose the codomain.

The problem is illustrated really well by this image from Wikipedia. The is domain is red, the codomain is blue, and image is yellow. But the range is either yellow or blue, depending on context. According to my poll, and the limited research of high school standards I’ve done, most would say yellow. But definitely not all agree with that.

That Topology book that I mentioned earlier uses the term “range” to refer to the codomain, and uses “image set” for the image. But, there is also a footnote stating,

Analysts are apt to use the word “range” to denote what we have called the “image set” of f. They avoid giving [the other set] a name.

Maybe the 20 people who all voted for ℝ were all topologists? Probably not. But, it shows that different people have different assumptions about what the range of a function means.

With all of this confusion around the meaning of the word, how are high school students supposed to understand what the range is? One solution would be to get rid of the word altogether. The words image and codomain already describe the two sets without any ambiguity, so we can just use those instead, right? We just need to define the two terms clearly, and the confusion in our classrooms will be significantly reduced.

Alas, students are still going to come across the range, whether that’s in a textbook, on a standardized test, or in their next class with another teacher. But there’s somewhere else we can turn for guidance. I’m a strong believer in the idea that whatever academic standards apply to your jurisdiction, you should follow them, regardless of your opinion of those standards. So if your standards use the word range, your class should too. I took a look at a few different standards to examine how they suggest the terminology of functions should be used.

Common Core is a bit of a disappointment here. The glossary does not define range, domain or even function. The standard CCSS.Math.Content.HSF.IF.A.1 states that a function “assigns to each element of the domain exactly one element of the range.” Which is an accurate description of a function, but it’s unclear if the range here refers to the image or the codomain.

Oklahoma (where I’ve taught most recently) defines the range in the context of relations, rather than functions: “The set of all the second elements or y-coordinates of a relation is called the range.” Now, this is not how I would’ve written this definition, but it is something we can work with. By this definition, the only values in the range are those that have a matching value in the domain, meaning the range is identical to image. If I were teaching high school classes again this year, I would teach the range as I have previously, but I’d also take the time to define the codomain as well.

The Australian Curriculum gives a nice, clear definition of the range, which matches the image, as well as defining the codomain, in the glossary for Mathematical Methods, under the heading “Function”. I don’t remember teaching the codomain explicitly when I last taught in Australia. Perhaps I should have.

Regardless of where you are, I’d argue that it’s important to define the range very clearly, according to your location’s standards. But also define codomain or image, depending on how range is defined.

The point I’m trying to make is this: As math teachers, we need to constantly examine the terminology we introduce to our students. Because sometimes we might not be being as precise as we could be. If you want your students to be really clear on the meaning of mathematical terms, make sure you are first.


Algebra 2 Practice Book ver 0.2.0

Summer means I have lots of free time to work on my book! Well, sort of. We’re in the middle of getting ready to move, so that’s taking up most of our time. But, there is more free time than normal, so I have managed to make some progress.

The major change is the addition of chapter 1, which is about the fundamentals of functions, with a particular focus on transformations. The only standard parent functions dealt with here are linear and absolute value functions, as this is an introduction to the principles that will be used with other functions in the following chapters.

I’ve rearranged some of the chapters in this revision, so the numbering is a little different than version 0.1.1 (that’s why I bumped up the minor version number.)

I am hoping that I will have chapter 2 written in the next few weeks, which will introduce quadratic and cubic functions.

Downloads are available here:

Mr. Carter’s Algebra 2 Practice Book
Version 0.2.0 (June 2, 2018)

Chapter 1: Functions

Chapter 3: Polynomials Part A (formerly Chapter 5)

Chapter 4: Polynomials Part B (formerly Chapter 4)

These are early drafts of what is very much a work in progress. All content is subject to change.

Copyright Shaun Carter © 2018. Teachers may reproduce these documents for use in their own classroom only.


My most used notebook template this year

Over the last summer I completely rethought my Algebra 2 course. Part of this is my focus on parent functions through the first part of the year, giving students a solid understanding of each function and their transformations.

To help focus on the fundamental properties of each function, we used the following template each time we introduced a new function.

Importantly, I had the students figure out details as a class. After stating the rule for the function, we always filled in the two-sided number line, with inputs on the top and outputs on the bottom. I chose to use a number line instead of a table, as it allows me to point out the continuous nature of the values between each mark on the line.

Then we filled in the domain and range, examining the inputs and outputs to determine these. We also determined if the function is one-to-one or many-to-one. I’m really proud of how my students have become increasingly confident in determining these answers for themselves from their own understanding of the functions and their values.

Next, we plotted the function on the grid. The number line is deliberately aligned with this grid to help students make the connection between the two. I have a SmartBoard template set up with points along the x-axis, with which we move points up or down to plot the function, to emphasize how the graph demonstrates the connection between input and output values. Then knowing the shape of the graph allowed us to easily fill in the rest of the table.

The inverse function section depended on which function we were talking. Sometimes we filled it in immediately, as most students understood x² and √x as inverses. Other times we waited to fill it in, such as with exponential functions which was completed before we talked about logarithms.

The second part of this template are the two “Graphing Example” section inside.

In the past, I’ve found students resistant to showing all the algebra they needed when they sketch a graph (usually because all they wanted to do was copy what their calculator showed.) I wouldn’t say this template has completely changed that, but it has made a big difference. Students complained a bit at the start of the year, but they’ve learned to appreciate the guidance this provides and gained a lot of confidence in their graphing ability. I know students probably don’t need to find the transformations of the parent function for every graph they sketch, but I think having them do this for each question we practice has helped their understanding of why each function produces the graph it does, and has helped serve as a check for the other parts of the template.

We’ve often had to leave the x-intercept section blank, because we’ve started graphing each type of function before we looked at solving equations involving that function. This has actually worked out pretty well. I found students accept my explanation that “We can’t do this yet because I haven’t taught you how.” Then, when we come solving those equations (typically the very next skill), I can use the need to find x-intercepts as a motivation for practicing solving equations. Then we go back to our graphing examples, find the x-intercepts, and add that detail to the graph. My students are sometimes annoyed that we jump backwards in our notes sometimes, but I think they appreciate that I’ve tried to avoid overwhelming them with too many details they don’t need to see all at once.

That’s been my approach all of this year: the idea that students don’t need to see all the detail until they’re ready for it. For instance, while we’ve talked about quadratic functions, we’ve only dealt with the vertex form, as that’s the form that can be explained through transformations, fitting the function pattern we’ve been following. Yes, we still need to talk about factoring, distributing and all that fun stuff. But now I feel we have a structure to build everything else on. I’m actually looking forward to completing the square this year, as I have a really useful motivation for it: it allows us to put quadratic functions into the form my students are already very familiar with.

We’ve introduced our last parent function now, so I’m not going to get any more use out this template this year. To be honest, I felt a little sad when we finished our last one, because it’s worked so well this year. Also, it means I’ll actually have to produce notes for each lesson now, instead of using the same ones over and over again…

You can find PDF and Publisher files here.
Included is a second version that leaves out the parent function template for a third graphing example.

Below you can find all the parent functions from my notebook for this year, as well as a couple of the graphing examples pages.

Linear Function
1

Absolute Value Function
2

Quadratic Function
3

Square Root Function
4

Cubic Function
5

Cube Root Function
6

Rational Functions
7

8

Exponential Function
9

Logarithmic Function
10

Graphing Examples
11