Unit Circle Spinner

While shopping the other day, I saw some of those decorative garden windmill things for sale at 50 cents each. Normally they would be the type of thing I would just walk past and ignore (not really one for gardening), but this time I had an light-bulb moment. So I bought a handful and came up with this creation:

Windmill and unit circle spinner
Before and after: the original “Windmill” and my Unit Circle Spinner.

Close-up
Close up view.

If you look at it from side on it gives a visual demonstration of sin (or cos from above), represented by the amount of yellow paper you can see and the direction it’s pointing in. For example, this is roughly showing that sin(π/6)=0.5:

Side view
(Trying to balance the spinner in the right place while simultaneously taking a photo was easier said than done.)

I’m not completely sure destroying a garden decoration was necessary to make this, but sometimes it’s good to take inspiration from wherever you find it.

I hope this will help my students understand the definitions of sin and cos (and tan) better than they have in the past. A lot of my previous students have seemed pretty happy to rely on mnemonics like “CAST” to remember where the different functions are positive or negative. Sometimes I wish I could tear that page out of their textbooks.


My first SBG units

Yesterday I wrotes about the reasons I’m experimenting with Standards Based Grading this term. Today I want to show how I’m planning to implement SBG in my classroom.

Because I was away in the last week of last term, we weren’t able to finish our unit on Pythagoras’ Theorem before the holidays. Because I was already planning to introduce SBG this term, I had already produced a list of skills and given them to the students before I left on the Year 7 & 8 camp.

Whenever I plan a unit (even before SBG), I like to copy the relevant standards and content descriptions from AusVELS, so I can clearly understand what I’m working towards:

Pythag AusVELS standards

I normally like to include content from levels above and below our year level, so I can cater for that range of student experience and ability. However, Pythagoras only starts at Level 9 in the Australian Curriculum, so I don’t have any previous levels this time.

From there I decided on my SBG skill list:

Pythag skill list

This week we did our first quiz, which I’m planning to do regularly on Thursdays. I’m enjoying being able to write questions that directly test each of the skills. I also like being able to set less questions while being able to demand higher quality responses from my students. Here’s one of the questions on that quiz, including a box for marking against the relevant skill:

Pythag quiz question

I have finished “content teaching” for Pythagoras’ Theorem, so we are just starting a new unit on Expanding and Factorising. I like the scope that SBG gives to retesting skills, so I plan to include skills from both units in this week’s quiz. For the new unit I also have my AusVELS standards:

Expand Factorise AusVELS

And my skill list:

Expand Factorise skills

So there we are, my first attempts at SBG. I’m sure this will need a lot of refinement over time. If anyone with more experience with SBG wants to give me any pointers or ideas, I would really appreciate it!


Testing the SBG waters

One of the changes I’m experimenting with this term is the introduction of Standards Based Grading. I’ve never really been satisfied with the systems I’ve used in the past for assessment. I really hope and believe that SBG could be what I’ve been looking for.

I’ve seen people claim that Australia’s had SBG for a long time, but either I’m really slow to pick up on trends or it’s not all that prevalent (I’m certainly not ruling out the first option). In Victoria at least, we’ve got what could be described as Standards Based Reporting, but I’ve never seen SBG implemented explicitly within a classroom setting.

Which is a pity, because AusVELS* seems to match well with SBG. Our standards are based on “Levels”, which is a subtle distinction from Years. The Levels match with where students are expected to be at the end of a given year. For example, at the end of Year 7, a student is expected to be at Level 7.

But the system recognises that students can be above or below these levels. Teachers are expected to give students opportunities to progress regardless of the level they are currently at. And our reports don’t show grades; students are given “progression points” indicating the level of the standards they have achieved. If a student is halfway through Year 8 and are at the expected level, they get a score of 7.5. If a student at the end of Year 3 is a year ahead of the expected standards, they get a 4.0. (Parents don’t actually see these numbers – they get a chart of dots showing their child’s current and previous progress.)

And helpfully, in maths there’s an extra level above 10 called “10A”, so high acheiving students are less likely to “run out” of standards to work towards in Year 9 & 10.

So this has been my dilemma: How do I write assessment tasks that both give my lower students opportunities to succeed and give my top students opportunities to demonstrate the higher standards? A number grade doesn’t work. Even though our system’s been based on progression for a long time, students can’t get the idea of “pass/fail” out of their heads, and if you don’t tell them what a passing grade is, they just assume it’s 50%.

Which means I end up either writing an easier test, which everyone is capable of passing but doesn’t let top students show their progression; or I include harder questions which challenge the top students but drops the score of the lower students below 50%, even though they may have progressed well to get to that point.

Over the last few years I’ve experimented with a few different marking systems, but have never really been satisfied. At one point I tried a “star” system, where I gave each question a rating from 1 to 3 stars based on its difficulty, and gave each student a seperate grade for each star rating. As you can imagine, that was convoluted, messy and confusing for both the kids and me.

Other times, I’ve written up to three different tests of different difficulties for the same unit. But then I need to decide which students do which tests. So I need to know what level the students are at before they do the test. But that’s the information the test is supposed to give me. Either that, or I let the students choose themselves, which inevitably leads to some students being overconfident and choosing a test harder than they should, or some top students feeling lazy and choosing the easy test.

So instead I fall back to using the simple number grade. But I find the numbers I give were only ever for the kids’ benefit, and never really provided useful feedback anyway. When I came to writing their reports, I’ve always had to pull their tests out again so I could check where their responses fit within the AusVELS standards. I often wondered why I bothered marking the tests in the first place.

I realised that I need a way to assess students against each standard seperately, using a grading system that easily lets me match students against the AusVELS levels. Luckily, I stumbled across SBG shortly after this realisation. I started planting some of the seeds for the idea of SBG with my Year 9 class at the end of last term, giving me the opportunity to start it properly this term. The school holidays were very useful for more research and planning into SBG (this Global Math Department presentation was very conveniently timed for me!). After one week, the students have understood our new assessment system quickly and seem to be on board with it.

Originally this was going to be a post about how I’m implementing SBG, but all I’ve really talked about is why. I think this was still good, just for me to make my own reasoning clear to myself. But it does mean the post I meant to write now still isn’t written. So, hopefully I’ll get to that in the very near future 🙂

* Australia is currently in the process of developing and introducing the Australian Curriculum. Maths, English, Science and History are already implemented for F-10. In my state of Victoria, we use the term AusVELS to refer to our current mixture of the new Australian Curriculum for completed subjects, and the old standards (VELS) for subjects that are still a work in progress.


$15 Graphics Calculator Unboxing

So I was in Kmart the other day, and saw this calculator on sale for $15:

Calculator in box

Wow! I thought. Can you really get a quality graphics calculator for $15?

Okay, not really. But I still bought it anyway, for a reason even worse than gullibility: pure curiosity. Surely this is terrible. How terrible can it be?

But let’s give this calculator the benefit of the doubt. Maybe it will blow me away. Maybe Kmart have managed to make a decent calculator affordable where TI and Casio haven’t. (Well, I assume the big names know how to make an affordable graphics calculator. They’ve just chosen not to…)

The back of the packaging promised these features:

features
Dot matrix! Like the old printers!

Inside I found the calculator, a cover and a surprisingly thick instruction manual:

contents
Gee, the design on that cover sure looks familiar…

After eventually figuring out how to remove the cover (it just pulls off instead of sliding), I found the calculator very comfortable to hold. It’s lighter than my phone, and has a nice rubber edging to it. So there’s one plus!

I pushed the ON button, and… it turned on! All going well so far.

But going by the features listed on the package, while it’s all technically true, I would never want to rely on them in the classroom. Despite the screen being big enough for more, it can only show one and a half lines of text. The “dot matrix” only covers about half of the screen, which is the area used to draw a graph. I did get it to draw this nice(ish) looking graph:

sine graph

That is a graph of y = 0.5 sin(π•x/12). I only got it to look like that by defining the screen dimensions manually. That is, because I already know exactly what the graph looks like. It would have been a lot quicker and easier on paper.

And there is a trace function. It shows a flashing dot on the curve that you can move, and nothing else. Certainly no values. But, you know, it traces!

How does it go with calculations? It works well enough as a basic scientific calculator. But apparently this is a valid input:

no closing parens
Of course it’s 16. What do you mean the parens should match?

I was curious how many levels of this you could have before you got a stack error. Answer: 12.

And it’s programmable. Apparently. Though I did some programming with assembly code at uni, that seemed a lot less archaic than what the instruction manual was suggesting for this calculator.

Programming
Argh! The goto! The goto!

Honestly, for the price it really doesn’t do that badly. But for a similar price, you can get a decently made scientific calculator with actually useful features, like displaying fractions properly and remembering past inputs. There’s really only one use case I can think of for buying a calculator like this: if you’re a maths blogger, and you feel like writing something silly instead of something interesting and useful.

Is that joke worth $15? No, not really.

I did buy other stuff that day that I plan to make use of for real maths lessons. I’ll blog about them one day, when I’m not feeling so silly.


Term 3, Problem Solving, and a Sick Day

Okay, I want this post to be as positive as possible. But to do that, I’m going to have to feel sorry for myself for a little bit. Feel free to ignore the next few paragraphs.

I’m currently in bed, where I’ve been for most of the day. I’ve got some sort of cold/fluey type thing that I’ve been trying to ignore for the last couple of days, but it finally got to me. The good news is that I wasn’t going to be teaching today anyway, so I didn’t need to rush to organise classes for extras, but I did miss out on the PD I was supposed to go to.

I absolutely hate taking days off, because I feel like I’m letting my students down. It’s a struggle to fit in everything I want/need to do with my classes as it is, before allowing for lessons my body refuses to let me get to. I’ve had a good run with not having to take many sick days, so I guess I can’t complain too much.

The fact this is the first week of term just makes me feel even more pathetic. I imagine there are certain critical types who would want to say how this is typical of the laziness of the teaching profession. I suggest those people visit me to say that to my face. So they can enjoy me coughing all over them as they say it.

So anyway, I am feeling a lot better than I did this morning and I’m fairly sure I’ll be back at school tomorrow.

The first two days of term were a lot better than today. Monday felt in many ways like the first day of the year rather than just the start of a new semester. Part of that was changing electives to ‘Robotics’, though all the students in that class were also in my Web Development class last semester, so it didn’t take long to do the introductory stuff.

But I’m also seeing the new term as a chance to reset with my Year Nine class, just a little bit. I’m not saying that the first half of the year was terrible, because it wasn’t, but there’s lots of things I want to work on and experiment with. I spent the start of Monday’s lesson explaining to my students a few of the changes I’m making, but also explaining that I want our focus to be less on “getting the right answer” and more on thinking as mathematicians.

This class is very competitive, which can be useful at times, but has sometimes meant their aim has been at completing the work before others (or for the weaker students, just giving up when they can’t keep up). I’m trying to get them to aim for improving their own ability in thinking mathematically, even if that means working slower at times.

The class was very disappointed when I told them New Things Thursday was no more. When I explained that New Things was moving to Monday, they were both happy and annoyed that I’d tricked them (and fair enough, but I couldn’t help myself).

Monday New Things
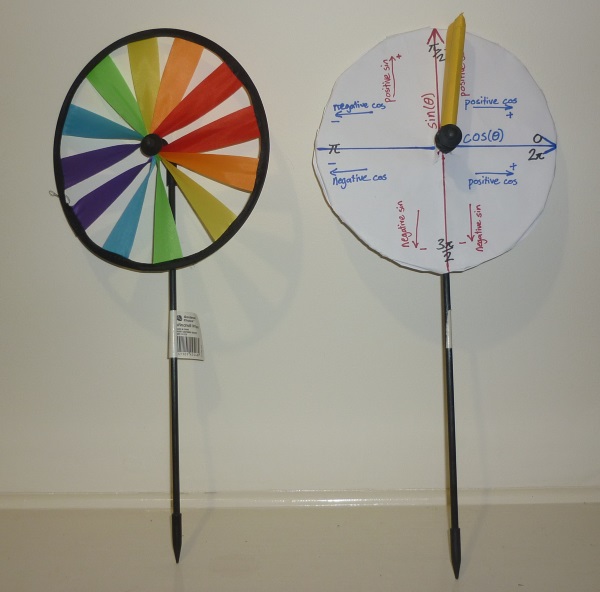
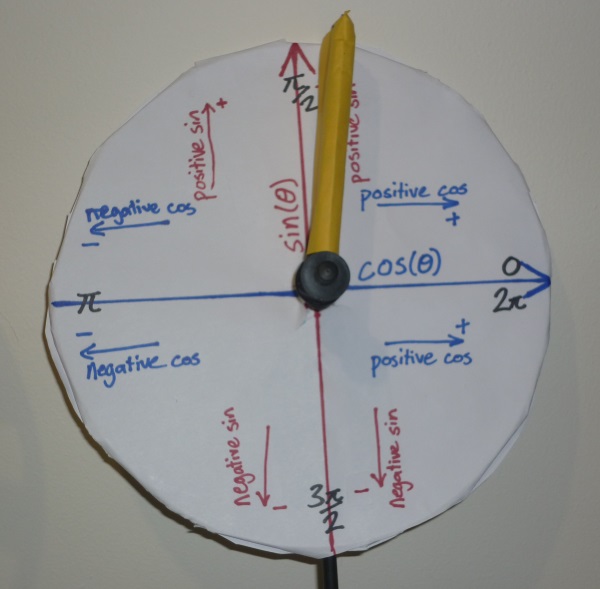
New day needs a new graphic!

This week, New Things focussed on new problem solving techniques, rather than on new content. In the past, I don’t think I’ve spent enough time teaching problem solving explicitly. The difficulty with teaching this is, though, is avoiding listing a specific set of steps to follow – I want my students to think about the problem mathematically, not follow a recipe.

I gave the class this problem:

A flagpole is secured by attaching a fixed length of wire between the top of the pole and the ground.
How far from the base of the pole is the wire attached to the ground?

The students immediately complained that they couldn’t answer the question. “There’s no numbers there!” When I asked them to clarify, they said the lengths of the wire and the pole were missing.

The point I was trying to make was this: You don’t need ‘numbers’ in order to think about a problem mathematically. So with encouragement from me, the class set about exploring the problem:

  • We drew diagrams of the scenario.
  • We defined the variables involved and gave them pronumerals.
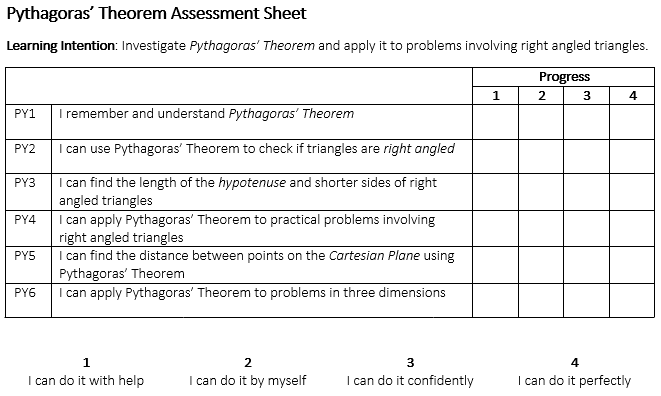
  • We wrote equations using those variables and Pythagoras’ Theorem.

“We still don’t know the measurements!” came the complaints. So I suggested they each write down reasonable measurements of the pole and the wire, and make an estimate of our unknown distance. Then I set these two tasks:

  1. Using your own measurements, calculate the distance from the base of the pole to the wire attachment.
  2. Make the same calculation using your neighbour’s measurements.

A few observations I made while students were doing this:

  • Some struggled to choose an estimate, including a few who usually excel in this class. This is a type of thinking they aren’t yet comfortable with, which was exactly what I was looking for.
  • Students were checking their answers against their estimates, and asking me if they thought their answers didn’t make sense. (Yeah!)
  • Conversations naturally developed around the room, with students comparing and discussing their answers with each other. (Double yeah!)
  • Students were sometimes puzzled by their results. Some asked me questions like, “If I add a meter to the ground, why doesn’t that add a meter to the wire?” Then, with a little prompting, they were able to reason through their confusion using both the equation and their description of the scenario. (Yeah! Yeah! YEAH!)

Suffice to say, I was pretty thrilled with how it went.

There’s still plenty of improvements I want to make to this style of lesson. For example, I wish I had a photo, or even a 3D model to go along with the scenario. I wish I could get the class to ask the question (or other related questions) without me writing it out explicitly. Also, the fact this was part of our unit on Pythagoras’ Theorem made it fairly obvious that it would be part of the solution. But I think this was a good start to getting my students to think about problems differently.

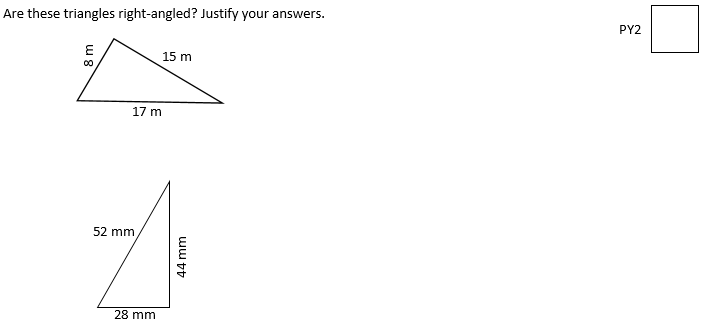
I gave the students a handout with problems of progressive difficulty (links below) to tackle for the rest of the lesson. I gave them the freedom to choose which ones they wanted to do, by cutting and pasting the questions into their books. Some of them still aren’t thrilled about the cutting and pasting thing – they still prefered to rewrite the question themselves. Oh well, I guess some 15 year olds are just too cool for glue. I’ll win them over yet.
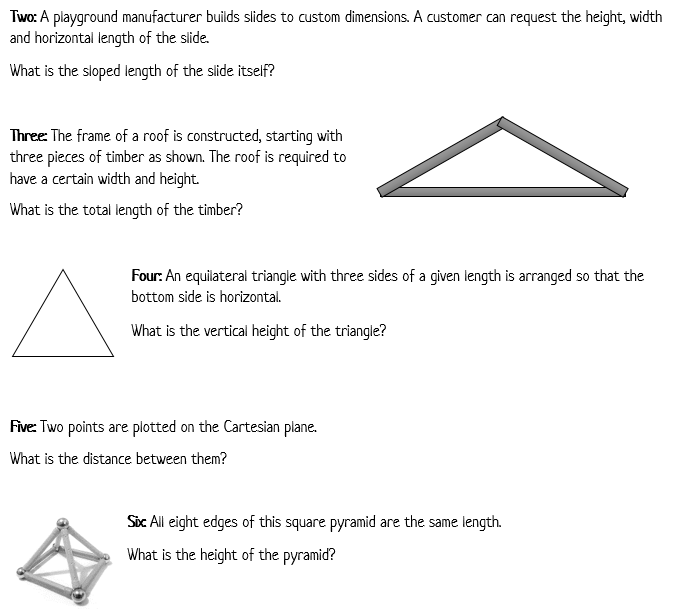
rest of the questions

Downloads: