Student given factorising questions (or, How to fake being organised)

While my Year 9 class is starting to move on to Area and Volume, I’m still quizzing them on Expanding and Factorising. At the start of Monday’s lesson, I planned to hand out a short set of factorising practice questions to warm up with.

At least, that was the intention. As it turned out, I only remembered that when I walked in the classroom door.

I could’ve moved straight onto the main activity for that lesson, but I still wanted to do some factorising questions first. So I did what any teacher does when they forget something – pretend that’s what the plan was all along. As it turned out, the accidental result was better than my original plan.

I asked students (some volunteers, some I picked on) to give me examples of expressions that can be factorised, which I wrote on the board. I gave everyone a few moments to factorise them, then the class gave me their answers:

(I’m so sorry for my scrawling handwriting. I’ve never really had the patience to write on the IWB neatly.)

The third one was really interesting. Obviously it can’t be factorised, and my reaction at the moment it was suggested was to say that, but fortunately I held my tongue and left it there. That question mark represents a really good discussion the class had about whether this counted as factorising or not. Also, it was awesome that most of the class had already recognised that 1 was the highest common factor of the two terms. They decided it wasn’t factorising, because multiplying by 1 doesn’t change the expression, and it didn’t help simplify the expression.

This is one benefit of getting the class to suggest questions. Had I remembered to organise questions before hand, I would not have used a question like this and not led to that discussion.

I pointed out that all the questions had a numerical common factor. “Is this the only type of factorisation?” I asked. This led to a whole new round of student given questions:

With these, I love how a couple of students recognised that using x2 allowed them to make x the common factor. I also love how the last student refused to allow that pattern to continue, so looked for a different example. There’s much deeper thinking going on here – rather than just giving the answers, students were able to think about and discuss the nature of expressions and how they can be factorised. Which is pretty cool for a warm-up activity I didn’t plan.


Area of a Sector

(Quick confession: this was actually weeks ago. I’m not sure why it took me this long to get around to blogging it.)

Why do textbooks bother trying to explain concepts before each exercise? The kids don’t read it, I don’t refer to it. And the explanations take all the fun of doing mathematics out of it.

In case anyone wants a more pedagogically solid complaint than “takes out all the fun”: The book just gives students formulas and expects them to rote learn their use, rather than using discovery to build understanding.

Anyway, case in point: the area of a sector. The book basically says, “sectors, here’s a diagram, here’s the formula, go do questions.” I thought I could do better.

Enough with the textbook ranting, do some maths already…

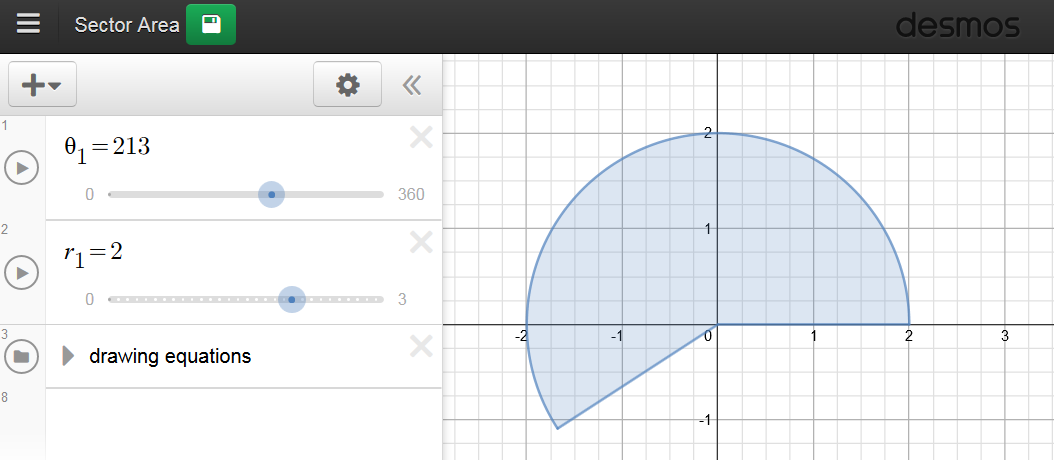
Normally this would’ve been something I’d use Geogebra for, but since I’ve become more than a little obsessed with Desmos lately, I went with it instead and put this together:

Desmos area of a sector

[Update 2/2/18: In more recent years, I’ve used another version of this that does both sector area and arc length. You might find that more useful. Link is https://www.desmos.com/calculator/mybwxhjws3.]

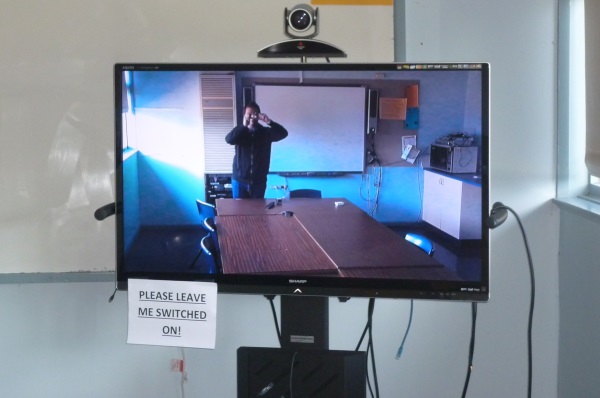
I started with the whole circle displayed on my IWB, and we talked about the effect of changing the radius on the area. This was revision, but I wasn’t particularly satisfied about how this discussion went – they got the idea that, say, doubling the radius quadruples the area. but when they gave reasons they only talked about r2. They couldn’t connect it to the circle itself. I moved on at the time, but I think I should’ve spent more time developing the idea.

So I changed the angle to 180°, and asked what the area would be now. “That’s easy, half the area,” came back the response. I showed them a few more angles: 90°, 270°, 45°. They responded with the appropriate fractions. So far so good.

“So what about 213°?” That had them stumped. “Well, maybe you should figure it out in your groups?” (Forgot to mention, I already had them in groups.) I gave them the link to open the Desmos file on their laptops to play around with while they discussed.

What I love is that there were different methods found around the room. Some found the fraction 213/360 quickly, but there were other approaches. Some found the area with 1°, then multiplied by 213. Some recognised that 213° is between 180° and 180° + 45°, and used that fact to determine lower and upper bounds on the solution.

This was a nice activity to differentiate, too. When some individuals found the solution quickly, I had them figure out the formula themselves. When they thought they had it, I made them explain it with their groups, who then discussed whether it worked or not. Others needed more time to find the area in the first place, but they all got there in the end.

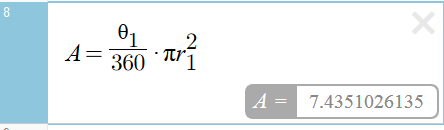
I then had each student create three different sectors using the Desmos sliders, which they then printed, stuck in their books and calculated the areas for. (The nice legacy of being in the former computer lab is having a printer in the room!) A few switched on students who had figured out the formula typed it into Desmos so it just calculated the area for them. I never told them how to do this! They thought they were so clever for “cheating” this way 🙂

Bonus features!

A few random tangents I thought of while writing this (I mean discussion tangents, not the … oh, you know what I mean.)

A couple of tech tips for you: To get the images of the of the sectors, I showed students the “Snipping Tool”, a feature of Windows 7 and 8 (and maybe earlier? I can’t remember when it came in.) I’m always surprised by how few people know about this. Everyone knows “Print Screen”, but that’s the old way to get screen images. If you only want part of the screen, Snipping Tool lets you drag a rectangle around only that part! So much easier than having to crop it after.

And my second tip: the easiest way to find it is hit the windows key, type “snip” and hit enter. And this works for any program! You don’t have to waste time searching the start menu/start screen to find that program you want if you know the name of it. Just hit the windows key, start typing the name of the program you want, then hit enter when it comes up. Works in Windows 7 and 8. Again, not enough people know this.

Ed-tech startups: listen, if you want teachers to actually use your product, follow the example of Desmos: make it easy to use, work on pretty much every device (preferably in a browser), easy to share with students, don’t require student logins and don’t make teachers create a new account to use it (use Google, Twitter, etc. to login). If I need to jump through hoops to use your product, I’m not going to bother.

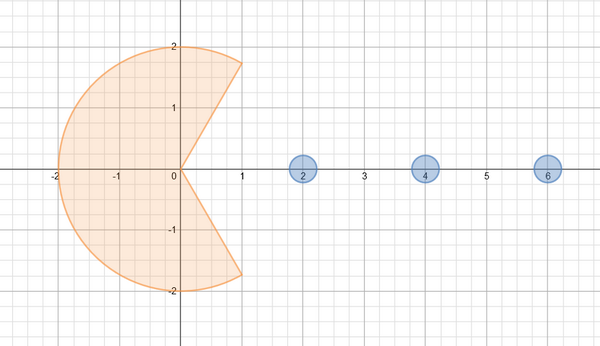
I’ve already shared this on Twitter, but you can’t draw a sector without thinking of Pac-man (or maybe pizza). So, I got distracted for a while and made this. (It’s actually animated of you follow the link!)

Pac-man!


Areas of shapes mini-posters

In my Year 9 textbook, the start of the chapter on area and volume starts with a “review” of areas from past years. And by that, I mean it says something along the line of “you should remember these formulas from Year 8,” then proceeds to list the formulas for the areas of various shapes.

Uhhh, no. Wasn’t going to cut it. I’m not doubting the importance of remembering the formulas, but the book makes a huge assumption that all students understood the formulas completely last year, and just needed a quick reminder before they jumped back into, I don’t know, completing boring lists of questions from the book I guess.

Instead, I didn’t just want my class to remember the formulas, I wanted them to explain how they work, where they come from. I broke the class into groups and assigned them different shapes. They had to produce a poster demonstrating how we can discover the areas of their shape using other shapes – ideally this would be something of an informal proof. Here’s some of the results:

This group didn’t end up showing the formula, but they did show the general idea behind the proof. With a bit more prompting, I’m sure they would have gotten to the formula.

Kite

This group showed two different methods for proving the area of a parallelogram, which is awesome. I especially like that the one using the rectangle didn’t involve any words. I think my students are slowly getting around the idea of using mathematics instead of English to communicate.

Parallelogram

I made this one. I thought the circle was a bit beyond my class, but I still wanted a poster for it.

Circle

Rather than trying to explain my poster myself, I showed the class this video from Minute Physics:


Grains Innovation Park

Happy National Science Week everyone!

While maths and IT are my main teaching areas, I do dabble in science from time to time. This is the first year I haven’t taught VCE Physics, and I do science pracs once a week with my Year Nines and another teacher.

And anyway, science is mostly just maths anyway 😛 (though I will admit, there’s a lot more setting things on fire in science, which is fairly cool).

So my link to the science department was enough to get me recruited for an excursion last week, which we did for National Science Week (which is actually this week). The theme this year is “Food for our future: Science feeding the world”, so we visited the Grains Innovation Park in Horsham. The GIP is a world class research facility in our region that I was barely even aware of until this excursion was being organised.

Broadacre cropping is the major driver of the economy around our school, and many of our students live on farms (also, I’m from a farming family myself). So being able to relate science to what many of our students see every day is pretty awesome. Because our school’s so small, we were able to take all of our Year 9-12 kids along.

I took my camera along, and made it my person mission to find any references to maths that I could. The biology teacher who organised the trip teased me about this. I probably deserved it.

Genebank seed packets

Foil packets storing seeds in the multi-million dollar Australian Grains Genebank.

Genebank freezer

Freezer used for storing seeds in the Genebank. These are kept at -20°C. We actually got to go in here briefly. It was a little worrying when we were warned not to touch any surfaces, “or you’ll be frozen stuck to it.”

Grain samples

A few small examples of seeds kept in the Genebank.

Lentils

Lentils growing in an “igloo”, or greenhouse.

Lentil multiplication

MULTIPLICATION! Oh, not that type…

Lab equipment

This lab is basically a fancy bakery. They produce bread from various varieties of wheat and test it to give information back to grain breeders and growers.

They also test how quickly various legumes can be cooked. Australia exports a lot of legumes to Asia, so they are trying to reduce the cooking time and therefore the amount of fuel required by poor peoples. A great example of using science (and maths, by extension) to make the world a better place!

Dough stretcher

This machine stretches dough, basically. It’s really expensive. Okay, that’s not fair – testing how far the dough stretches indicates … something I can’t remember.

AgFACE

The Australian Grains Free Air Carbon Enrichment Project has the greatest acronym ever: AgFACE! Here a ring of tubes pumps out carbon dioxide around growing crops, to see what affect future atmospheric carbon levels will have on our ability to produce grains.

My search for maths wasn’t fruitless. (Fruitless! Because it’s about grain? Oh, forget it.) I found some research posters with some really cool scatter plots and all sorts of interesting data that I got pictures of, but I think I’ll get in trouble with the copyright police if I post them here.


Coloured letter combination cards

If you read different teaching blogs, you will find thousands of brilliant ideas that have taken a lot of creativity, effort and planning to create.

This is not one of those. This was an idea I had during lunch, literally less than half an hour before the lesson started. And really, I should have done it earlier given how obvious it seems now.

So my Year 12 Maths Methods class has just begun Probability – so hooray, we’ve reached the home stretch! While combinatorics is a Year 11 topic, my students often forget how they work – indeed, most of the class had even forgotten what factorials are. In the past, I’ve demonstrated combinations by choosing from whatever set of objects I had close to hand – often my coloured whiteboard markers.

This year, I made these instead:

letter cards

Six laminated pieces of paper! Okay, I know I’m not really blowing any minds, but sometimes the really useful ideas are the simple ones. And I made four sets, so it’s twenty-four laminated cards, anyway 😉

Hopefully the paperclip gives some idea of how big they are – they’re actually a quarter of an A4 sheet each. There’s something about my class that I’ve never mentioned that makes the large size important. One of my students looks like this:

video conferencing system

Okay, my student isn’t a TV and a camera, not really. One of the issues of being in a small rural school is the difficulty in offering VCE classes. Sometimes not enough students choose the subject to justify it, and sometimes it’s difficult to get teachers who can teach those subjects. We have a few options for dealing with this, one of which is receiving classes via video conferencing from other schools. We contribute by delivering some subjects ourselves, including Maths Methods 3 & 4 by me.

One of my students is in another school, but is taught by me. At the other end, the student uses two TVs – one shows the view of the camera, and and the other shows my laptop’s screen. Because I use an interactive whiteboard, he can see everything I write, as well as anything I else I choose to display.

I made the cards big so they would be easy to see over the camera. There’s many challenges to teaching this way, but that’s a post for another time.

By the way, if you didn’t work it out, that’s me in the TV taking the photo.

Because this lesson was about combinations, we also got to talk about the ten pin bowling thing I mentioned a while ago.

If anyone wants the file I used to make the cards, you can get it here: lettercards.docx. Though I only spent a couple of minutes making it, so I’m sure a little effort could make something much better looking.