This blog is one month old! Woo hoo! I know that might not seem like much, but I have a bad habit of thinking of great ideas then not really sticking to them. This is something I really want to keep doing, because I can already see it making me a better teacher.
Case in point: I had an idea for an activity on the absolute value function this morning while still in bed. Problem is, on my usual timeline, I cover it in February. So under normal circumstances, I’d think “That’s a good idea, I should remember it.” Then I’d proceed to go back to sleep and immediately forget it (it is school holidays now, after all).
But this time, I actually got out of bed and starting testing the activity. Because now my thoughts and ideas aren’t just dumped in the back of my brain – I can use this blog as a way to process those ideas into something useful.
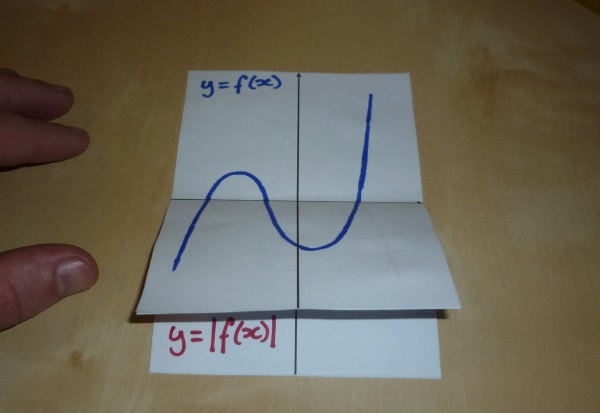
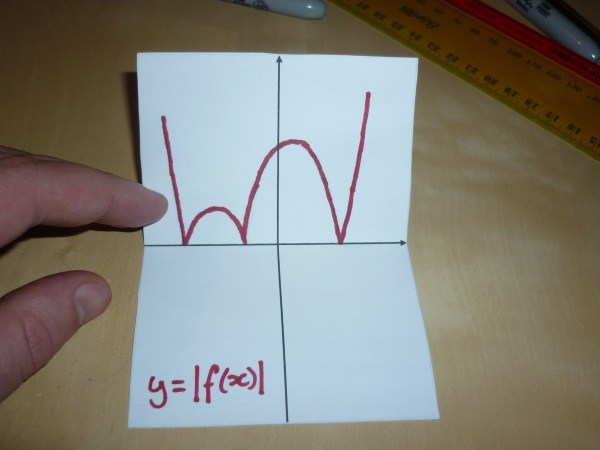
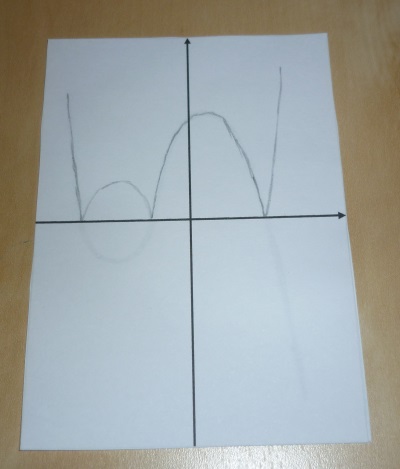
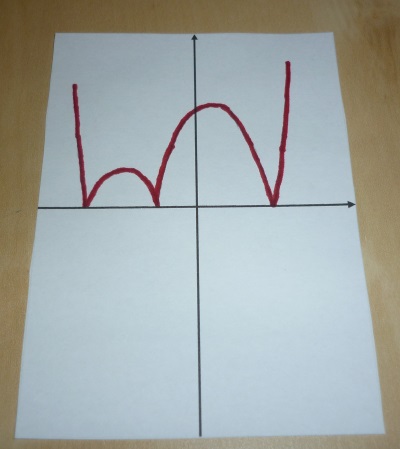
So I’ve created this thing which I’m dubbing the “Absolutamatron”. (I know that’s a horrible name. Please let me know if you have a better one.) I’ve often described the graph of the absolute value function as “flipping all the negative y-values to positive y-values”, but for some reason it had never occured to me to physically flip the graph. So I made this thing:
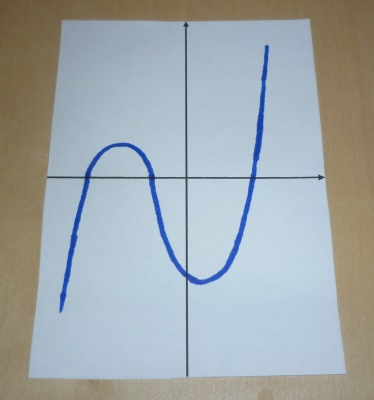
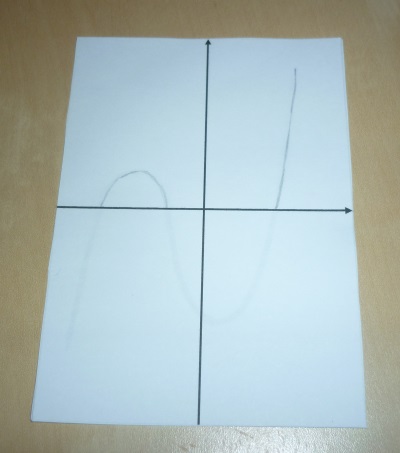
It doesn’t really matter what the function is, but this one is supposed to be f(x) = (x+3)(x+1)(x-2).
So I’ve never used this in class myself (as I said, I only thought of it this morning), but I think learning value for the students would be in making it themselves. I deliberately created the absolute function graph by tracing over the original graph, which is what I would have students do too. So this is how to do it:
You will need:
- Three identical blank Cartesian planes (which you can download here).
- Scissors to cut out the planes.
- Markers that will “bleed” through the paper (I used Sharpies). Use colour, because you don’t want to be boring!
- A pencil.
- A glue stick.
Step 1: Using a marker, sketch your first graph onto one of the planes. The function can be anything, but it needs both positive and negative values (polynomials work well).
Step 2: Cover the graph with another plane, being careful to line up the axes. Trace over the positive values only using a pencil.
Step 3: Flip the original graph so the bottom is at the top. Trace over the negative values (which are now positive).
Step 4: Remove the original and draw over the pencil markings using a marker.
Step 5: Fold each graph in half along the x-axis. Glue the top half of the original to the top half of the blank graph, and glue the bottom half of absolute graph to the bottom half of the blank graph. (Alternatively, you could just glue each half directly into a notebook.)
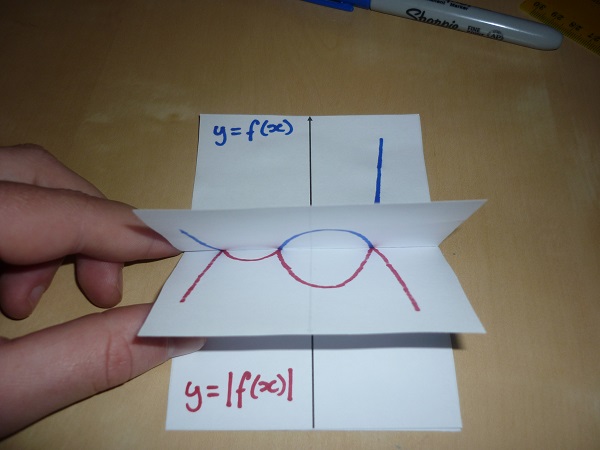
Step 6: Glue the middle bits together. Now you have your very own Absolutamatron!
So it’s really a simple little idea, but it’s an idea that I can guarantee I would have forgotten about by next year. I’ll put a warning on this in case it wasn’t clear: NOT CLASSROOM TESTED. Yet. But if anyone does give it a go, I’d love to know how it went 🙂
(And seriously, if you think of a better name, please tell me that too!)
One Reply to “Blogging? Absolutely.”
Comments are closed.