My Algebra 2 Practice Book

I’ve been working on a sort-of-secret project for the last couple of months. I decided to write my own book of practice problems for Algebra 2. Keep reading, and you’ll find a first draft of two of my chapters.

To be clear, this is not supposed to be a textbook. The way I see it, most math textbooks aim to do three things:

  1. Explain mathematical concepts.
  2. Give “worked examples” explaining how to do different types of questions.
  3. Provide a bank of practice questions.

“Explaining mathematical concepts” would be better described as “guiding students to a conceptual understanding of mathematics.” That’s not something a textbook can do because the textbook doesn’t know the students its guiding. I believe students are best served when they construct their knowledge of math themselves, under the guidance of their teacher.

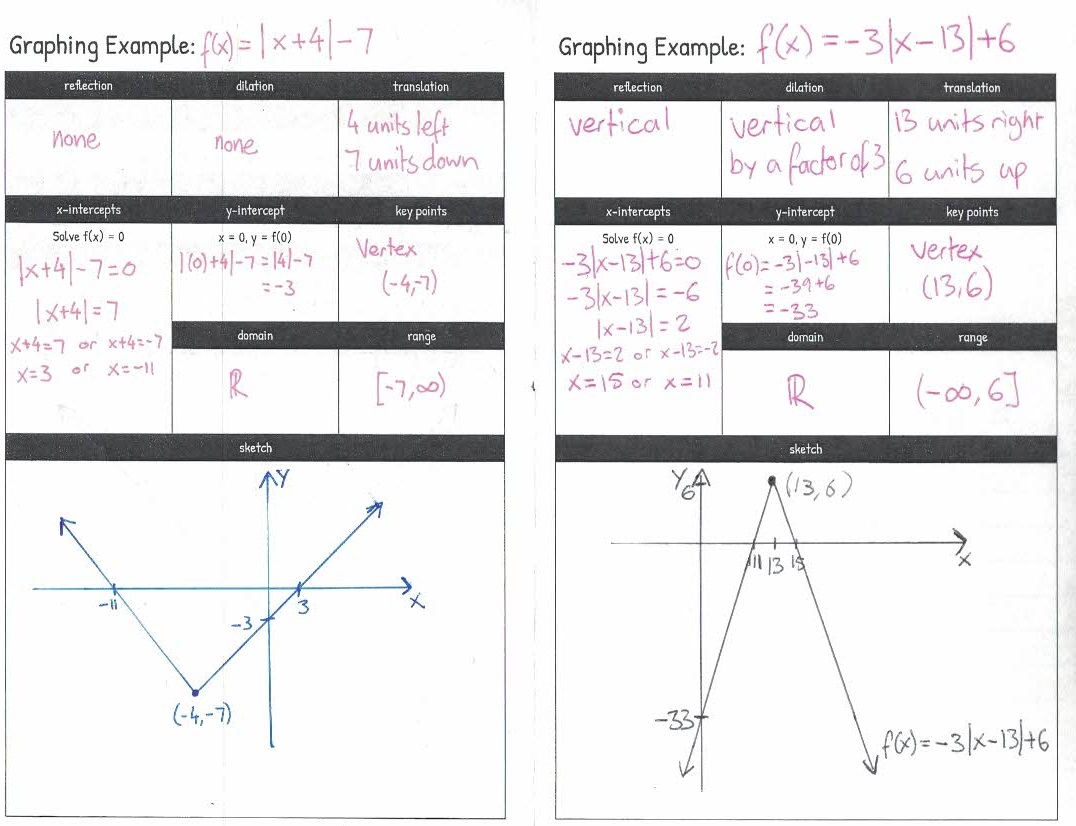
And the “worked examples” should be the job of the students, again, with guidance from the teacher. Those examples should be developed either by individual students, groups or the whole class as appropriate, with the teacher checking to make sure mistakes aren’t showing up along the way. Many of the examples in my classes end up following a slightly different path than I’d have followed, because it made the most sense to the students at the time. But a textbook’s examples are fixed, and don’t allow students to think of how they’d solve problems themselves.

That leaves us with the practice questions. This has been, in the past, how I’ve seen textbooks as being the most useful. But the textbooks I teach with (or more correctly, don’t teach with as they sit in the cabinet) don’t do a great job of that either. They are seriously outdated, and while they make some token effort of demonstrating their alignment with Oklahoma’s standards, they’re the old PASS standards, not the Oklahoma Academic Standards we’ve had for over a year now. And most of the time, it’s hard to find questions I can use, because the sequencing of the book is nothing like that of my class (probably because my sequence was developed by myself from the standards the book is not aligned to.)

That has left me looking to other resources (typically online) to find practice questions in. But that’s often frustrating too, and can sometimes result in spending hours searching for the type of practice assignment that I feel should exist, somewhere, but I just can’t find. Sometimes I find questions that assume knowledge my students don’t have yet, or assume my students don’t know something they do and don’t go deep enough. Or they prescribe a particular method to solve a question; there’s nothing more frustrating than a good assignment ruined by “use FOIL to.” Then, with my preparation time wasted, I have to create my own questions anyway.

I’ve often said, “Someone should write a book of practice problems for Algebra 2. Sort of like a textbook, but without the explanations and examples I can provide myself.” And somewhere along the way, “someone should” became “I should.”

To date, I’ve been following these objectives when writing this book:

  • All work should align to the Oklahoma Academic Standards, which I’ve mostly done by ensuring my existing units and skills align to the standards, though some questions may exceed the standards.
  • Avoid telling students how to solve a problem. I do break this rule sometimes (for instance, there’s a question where students are told to use completing the square, even though it isn’t needed, because practicing completing the square was the point of the question.)
  • Provide scaffolding through the sequencing of questions, rather than giving students too many instructions.
  • Where possible, provide some backwards, “Jeopardy”-style questions. As in, the solution was …., what was a possible equation?
  • Where possible, provide “Further Practice” sections, suggesting to students how they can create their own questions (often with a partner) if they’re looking for, well,  further practice.
  • Look as professional as possible. I’ve learned a lot about LaTeX recently…
  • All questions are originally my own. I own the copyright, so that I can use it how I like.
  • I’m sure there were others, but it’s late and I really need to get to bed…

Working title is “Mr. Carter’s Algebra 2 Practice Book.” But I don’t want it to just be mine, I want other teachers to make use of it as well. To that end, I’m planning to make various draft versions available to download even at this very early stage.

Mr. Carter’s Algebra 2 Practice Book
Version 0.1.0 (January 14, 2018)

Chapter 5: Polynomials Part A

Chapter 6: Polynomials Part B

Please, have a look through it, use it in your classroom if you’d like. I’d like suggestions, though please don’t be too harsh. As I’ve said, even these chapters I’m sharing are in a very early state. I’m actually feeling nervous about sharing this, as a lot of work has gone into it, but there’s a lot more work to do. But I’m taking a risk here, because I believe this project can do what my blog also aims to do: to make me a better teacher, and possibly help other teachers out along the way.


Linear Regression Intro Activity

Today in Statistics we started discussing linear regression. Before getting into the details of how it works, I wanted to help my students understand what we are trying to use it to achieve. That is, creating a linear equation that models bi-variate data.

To start with, I posted this data in Desmos on my smart board:

There’s nothing special about the data, they were just the numbers I happened to type into Desmos at the time. If I was going to do this again in the future, I think I’d want to source some real-world data to use. But as this activity didn’t have a whole lot of preparation go into it, there wasn’t a whole lot of opportunity to find that data. (That said, if you’d like to use my artificially created data, go for it.)

I had students create their own scatter plots for the data. Once they had done this, I told them to rule a line through the data that they thought summarized and modeled the data as well as possible. I informed them that there is an objective way to determine which equation does the best job of this, so it was now a competition.

Then the moment that revealed to us just how rusty some of their algebra skills are: I had them each find the equation of their line. After they complained that it’s been too long since Algebra 1 (despite most of them seeing this in Algebra 2 or Geometry with me last year), and a quick recap tutorial on slope-intercept form, they were able to find their equations.

Then to compare them, I typed their equations into Desmos so that we could visually compare them. I’m happy to say that most of the equations fit the data reasonably well, at least to the naked eye (which is, of course, all my students had to work with for the activity.) Then, I added one more line: the regression equation created by Desmos itself (in orange.)

One of the lines (the blue dashed one) is actually very close! I also changed all of my students’ equations into regression equations, so we could compare their R2 values. For now, I just told them that this is a measure of how well the model fits the data. In future lessons, I will explain the more formal meaning to them.

To finish our discussion, I had Desmos plot the residuals for the linear regression equation, as well as for some of the students’ equations. I explained that what Desmos was doing was trying to make these residuals as close to zero as possible. Over the next few days, we’ll start to get into the details of how the mechanisms of regression actually work. But for this lesson, I wanted to give students a sense of what regression is about, rather than how it works.


Quadrilaterals Card Sort

Here’s a card sort I created for the definitions of the special quadrilaterals.

Each group contains four cards: the name of the quadrilateral, a diagram, the definition, and a list of the other shapes quadrilateral is an example of. The diagram shows only the information that’s stated in the definition. Other properties of the quadrilaterals are covered in the following skills (some of which I’ve already blogged about.)

Downloads are here.


Parallelogram and Rhombus Theorems

First day back from Christmas break saw my Geometry classes looking at theorems about parallelograms and rhombuses. We’d already looked at definitions of the different types of special quadrilaterals. I had students divide a page in their notebook in two, and told them to rewrite the definitions of the parallelogram and rhombus in those sections.

While they were doing that, I passed out a set of four Exploragons to each student, with two each of two different colors/lengths. I also made sure that each pair of students received the same colors, which will be important later.

If you haven’t used Exploragons before, they’re plastic sticks with little nubs that allow the sticks to snap together to make different geometric arrangements. Other companies sell them as AngLegs, though I think prefer Exploragons as they have nubs in the middle of the sticks, not just at the ends. When I started teaching at Drumright, I had the opportunity to order hands-on supplies to use. I’ve found that of everything I’ve ordered, these are the most versatile physical tool I have for teaching Geometry.

I gave students the instruction to construct a parallelogram from the pieces I gave them. Thankfully, they (mostly) ended up with something like these:

I then instructed them to write down everything they noticed about their shapes, and to discuss what they notice with the students around them. Answers ranged from what I was hoping they’d notice (opposite angles are the same, opposite sides are the same length) to not as useful (“it’s a shape”), but getting the perfect answer wasn’t really the point. I wanted students to understand that there are things about these quadrilaterals we can know are true aside from just their definitions.

Next, I told students to do the same thing by making a rhombus. Thankfully, they realized I didn’t have the right pieces to do this A few looked at me incredulously, a few demanded I give them more pieces (which I refused), but slowly a few students worked out what they needed to do: trade pieces with the person next to them.

Once students had had time to write down their observations of their rhombus, we started our notes summarizing the theorems for these quadrilaterals. I used the observations as a springboard into this conversation, pointing out that some of the theorems matched what they’d noticed, and some didn’t (particularly the ones involving diagonals.)

After, students started the activity I put inside the notes. For each diagram they needed to identify four things:

  1. What the shape is (admittedly not too difficult, as there’s only two to choose from.)
  2. How they know it’s that shape, based on either one of the theorems or the definition of the shape.
  3. The value of any variables in the diagram.
  4. How they know it’s that value, again by referencing a theorem or definition.

There is a flaw in these questions. All of the parallelograms have a horizontal pair of sides, while the rhombuses are in a “diamond” position. This made distinguishing the two a little too easy. If I get a chance, I’d like to rotate some of the diagrams to different angles.

Downloads for these notes can be found here.


My most used notebook template this year

Over the last summer I completely rethought my Algebra 2 course. Part of this is my focus on parent functions through the first part of the year, giving students a solid understanding of each function and their transformations.

To help focus on the fundamental properties of each function, we used the following template each time we introduced a new function.

Importantly, I had the students figure out details as a class. After stating the rule for the function, we always filled in the two-sided number line, with inputs on the top and outputs on the bottom. I chose to use a number line instead of a table, as it allows me to point out the continuous nature of the values between each mark on the line.

Then we filled in the domain and range, examining the inputs and outputs to determine these. We also determined if the function is one-to-one or many-to-one. I’m really proud of how my students have become increasingly confident in determining these answers for themselves from their own understanding of the functions and their values.

Next, we plotted the function on the grid. The number line is deliberately aligned with this grid to help students make the connection between the two. I have a SmartBoard template set up with points along the x-axis, with which we move points up or down to plot the function, to emphasize how the graph demonstrates the connection between input and output values. Then knowing the shape of the graph allowed us to easily fill in the rest of the table.

The inverse function section depended on which function we were talking. Sometimes we filled it in immediately, as most students understood x² and √x as inverses. Other times we waited to fill it in, such as with exponential functions which was completed before we talked about logarithms.

The second part of this template are the two “Graphing Example” section inside.

In the past, I’ve found students resistant to showing all the algebra they needed when they sketch a graph (usually because all they wanted to do was copy what their calculator showed.) I wouldn’t say this template has completely changed that, but it has made a big difference. Students complained a bit at the start of the year, but they’ve learned to appreciate the guidance this provides and gained a lot of confidence in their graphing ability. I know students probably don’t need to find the transformations of the parent function for every graph they sketch, but I think having them do this for each question we practice has helped their understanding of why each function produces the graph it does, and has helped serve as a check for the other parts of the template.

We’ve often had to leave the x-intercept section blank, because we’ve started graphing each type of function before we looked at solving equations involving that function. This has actually worked out pretty well. I found students accept my explanation that “We can’t do this yet because I haven’t taught you how.” Then, when we come solving those equations (typically the very next skill), I can use the need to find x-intercepts as a motivation for practicing solving equations. Then we go back to our graphing examples, find the x-intercepts, and add that detail to the graph. My students are sometimes annoyed that we jump backwards in our notes sometimes, but I think they appreciate that I’ve tried to avoid overwhelming them with too many details they don’t need to see all at once.

That’s been my approach all of this year: the idea that students don’t need to see all the detail until they’re ready for it. For instance, while we’ve talked about quadratic functions, we’ve only dealt with the vertex form, as that’s the form that can be explained through transformations, fitting the function pattern we’ve been following. Yes, we still need to talk about factoring, distributing and all that fun stuff. But now I feel we have a structure to build everything else on. I’m actually looking forward to completing the square this year, as I have a really useful motivation for it: it allows us to put quadratic functions into the form my students are already very familiar with.

We’ve introduced our last parent function now, so I’m not going to get any more use out this template this year. To be honest, I felt a little sad when we finished our last one, because it’s worked so well this year. Also, it means I’ll actually have to produce notes for each lesson now, instead of using the same ones over and over again…

You can find PDF and Publisher files here.
Included is a second version that leaves out the parent function template for a third graphing example.

Below you can find all the parent functions from my notebook for this year, as well as a couple of the graphing examples pages.

Linear Function
1

Absolute Value Function
2

Quadratic Function
3

Square Root Function
4

Cubic Function
5

Cube Root Function
6

Rational Functions
7

8

Exponential Function
9

Logarithmic Function
10

Graphing Examples
11